Understanding price action is essential for successful trading, and one key aspect is analysing candlestick patterns. These patterns provide valuable insights into market dynamics, with the size of candles playing a crucial role. Larger candles indicate strong momentum and potential trends, while smaller ones suggest uncertainty or lack of clear direction.
Traders leverage candle size to pinpoint entry and exit points, manage risks, and gauge market sentiment effectively. By examining how candle sizes correlate with trading volume, traders can make more informed decisions based on visual representations of price movements.
Date & Price Range Tool
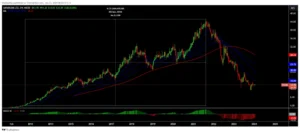
- An essential tool for gauging the momentum of an asset is the Date & Price Range tool. This feature enables users to vertically position points on two distinct prices. A text box displays crucial information, including the total size of the price movement in terms of actual share price, percentage, and the duration of the move. For instance, the chart below illustrates a movement that lasted 3234 days and resulted in a +1024.43% increase.

Image credit :Tradingview.com
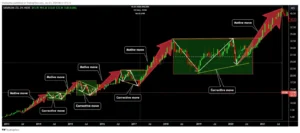
Once you’ve grasped price action and determined the direction of the trend, the next step is identifying patterns that signal optimal entry points. Our focus lies on two key elements: motive moves, indicating the trend’s direction, and corrections, offering favourable entry opportunities. Motive moves represent significant trading opportunities, while corrections provide ideal moments to enter the market. Recognizing these patterns equips us with the knowledge to make informed trading decisions, enhancing our chances of success. Below, we’ll explore a prime example of these patterns in action.

Understanding Entry Points:
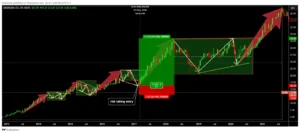
After spotting patterns in trading, the next step is deciding when to enter the market. There are two main approaches: risk entries and risk-averse entries. Risk entries are often associated with motive moves, signalling a trader’s readiness to embrace higher risk in pursuit of potentially greater rewards. Below, we’ll look at both of these strategies to provide a comprehensive understanding for traders.
Risk Taking Entry

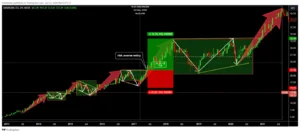
Risk Averse Entry

Here,the correction has already occurred, and a trend has been established. As a result, the risk-to-reward ratio is reduced, leading to lower potential profits.


