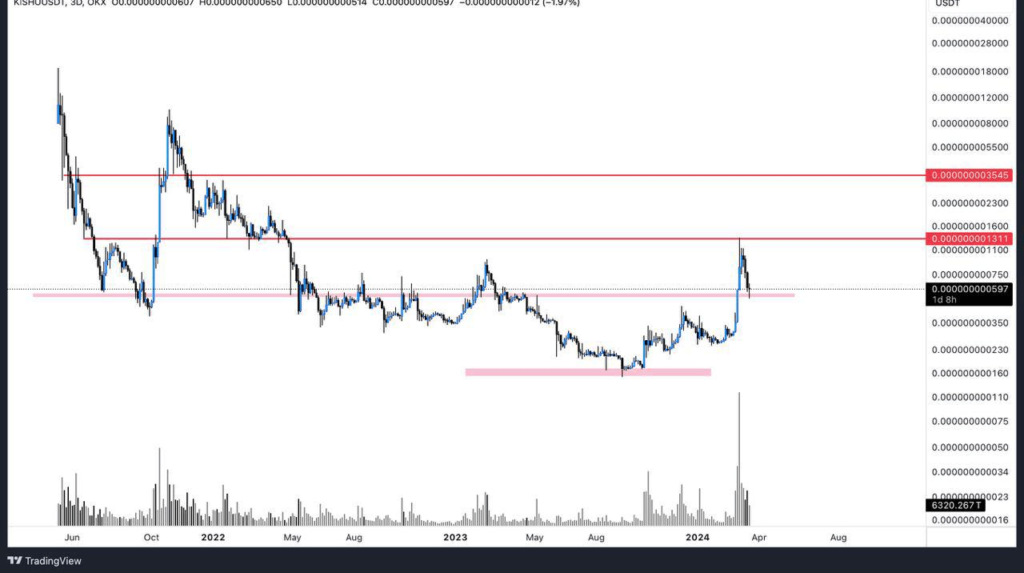
The KISHU/USDT pair has it’s significance among digital currencies. In this technical analysis, I will explain the chart analysis and potential investment opportunities in this pair.
In the KISHU/USDT chart, we are currently observing the 3-day time frame, which presents a favorable area for investment. The potential target could be the next two resistance levels, as indicated in the chart Let’s have a look at the chart to understand the trend in detail.

This analysis of the KISHU/USDT chart reveals promising opportunities for investors.


