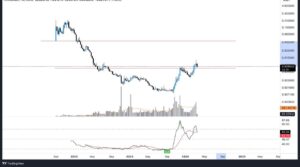
We’ve moved beyond the typical Fibonacci levels and are now focusing on smaller price movements. For the bigger picture, a common pattern called an ABC correction usually ends within certain Fibonacci levels, typically between 1.0 and 1.382. Sometimes it can go even lower to 1.618.
Right now, I’m simplifying things by only considering the current pattern, so I’ve removed some Fibonacci lines. Now, I’m just using one set of Fibonacci levels based on recent price movements starting from July 27, 2023.
By doing this, we can try to predict where the price might bottom out. If it follows a standard ABC pattern, it should end within a certain target range. The worst-case scenario, according to this analysis, is that the price could drop to around $8.84. But if it bottoms out within the target range, we could see a rally to at least $19-$23.
If it drops to the lower Fibonacci level, the target range for a bounce-back would be $18-$22. It’s hard to say how long this will take because corrective patterns can happen quickly or take a while. Right now, this is the main information we have to form our strategy.
The MACD indicator usually hits its low point during the first phase of a corrective pattern. As of now, that low point was around the beginning of October 2023.


