Today, I want to look at Bitcoin over the past week to see how it’s been moving and what might happen next.
Let’s have a look at the one-week chart of Bitcoin to predict what might be the upcoming trend and continuation of Bitcoin’s movement. We have an Ascending Channel where it is moving. This channel is strong and durable and gives support and resistance in the middle line.
Now, Bitcoin (after a long period of being sideways) is close to the middle of the fixed channel with other important levels, such as the pitchfork line, resistance lines, and the PRZ (short-term reversal zone) between $82.8k and $73.2k. The lowest point of Bitcoin on this chart shows that this area is a strong place for Bitcoin to build resistance.
Let me explain it with the help of the charts that illustrate patterns from the 2020 Halving. We can say Bitcoin could go in the same direction as Bitcoin took before the 2020 Halving. It is done through the rounding of the figures which points to a correction between the 23.6% and 38.2% Fibonacci levels, keeping out the 50% related to the COVID situation.You can have a look at the chart below to observe the move.
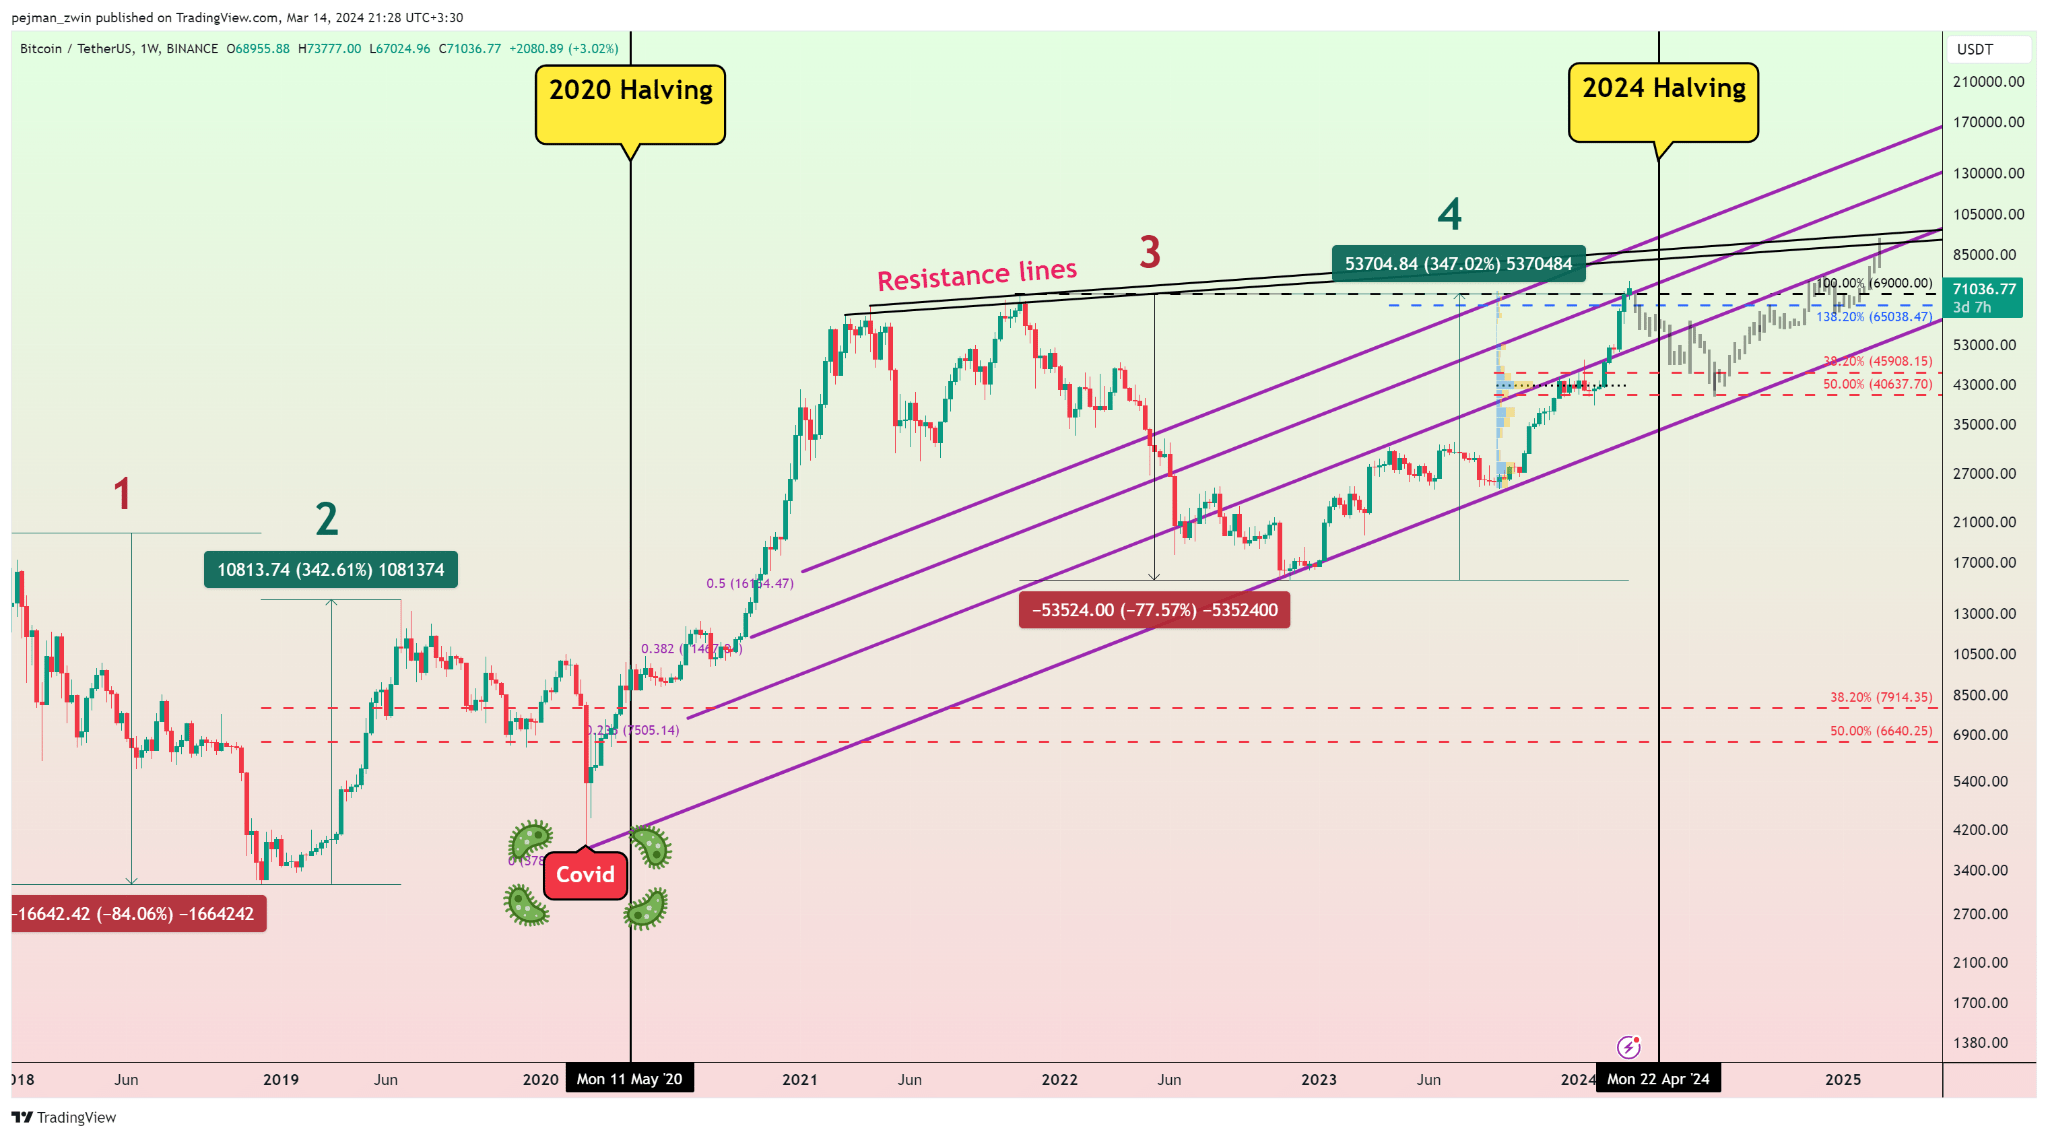
Tradingview.com BTC/USDT
The Theory of Elliott waves predicts that Bitcoin will adopt either the Bullish or Bearish scenarios. This will be determined by news and upcoming forthcoming news events.
🚀 Bullish Scenario
Among other things like the Halving and the ETF are in their run, Bitcoin can see itself to have passed wave 3 at $73,777 as its top currency. Given such information, we could afford to foresee the inception of main wave 4 and a hike upwards through $87,000, $99,000 and maybe even $112,000.
🚨 Bearish Scenario
If Bitcoin does not manage to keep this Heavy Support line between $50,000 and $38,500, there can be a risk of more prominent depreciation to look for. In such a case, the price of Bitcoin can be as low as $18000. Such a low price can be predicted.
Nonetheless, these conditions have slowed down the asset price fall, preventing such a scenario from becoming a reality. Prices totaling $77,000 and over might cause some change on this bearish construction.
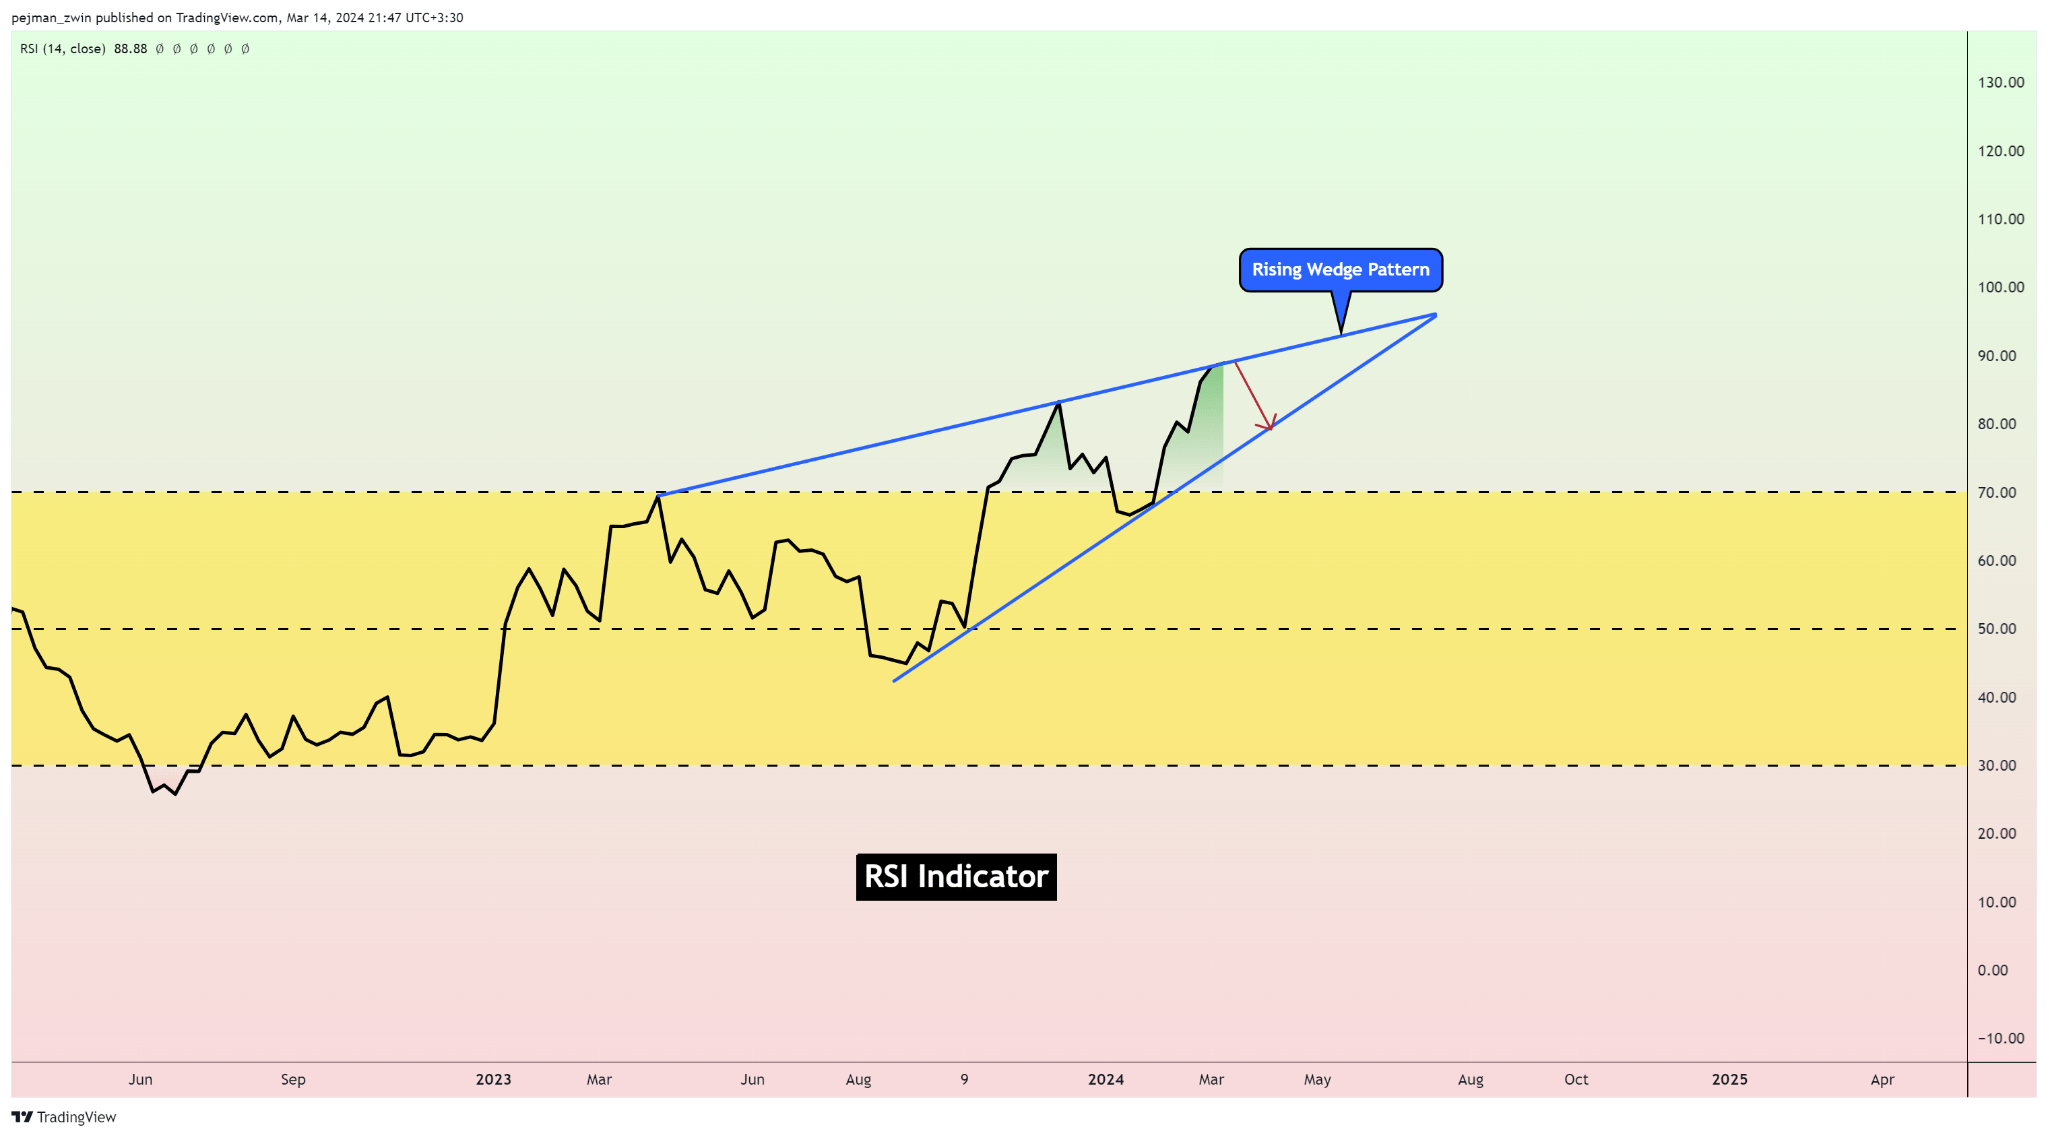
RSI Indicator
💡On the weekly RSI graph, a Rising Wedge pattern is seen to have formed a shape. This also shows the signs of the correction of Bitcoin.
On the 1-hour chart, the Bitcoin is picturing an Ascending Broadening Wedge pattern which might signal the beginning of positive feedback and correction of the Bitcoin.
🔔As a consequence of this notice, there is a high probability that the Bitcoin correction can occur very soon therefore, it will likely drop to the Heavy Support zone range between $50000-38500. This could be followed by a small decline when we would wait to see if Bitcoin’s move will continue and possibly be followed by another price increase.
If Bitcoin produces a shooting star candlestick pattern on the weekly graph, the chances are that the trend will most likely be a correction.
Also, do not leave out the order for stop-loss on your positions before opening them.
I am not saying so but just, you know, be your trader and make your own trading strategy. It would be great to know how you felt about this piece.
Fair trade expresses my anxiety and discomfort, so trade safely.
Please do not forget the ✅’ like’✅ button 🙏😊 & Share it with your friends; thanks, and Trade safe.