Intraday analysis of XAU/USD (Gold Spot/U.S. Dollar) provides a complete overview of the movements of gold prices against the US dollar within a single trading day.
You can better understand market trends and make informed decisions by analyzing multiple time frames.
In this article, I will help you to understand the intraday analysis of XAU/USD and complete H4 and M15 analysis.
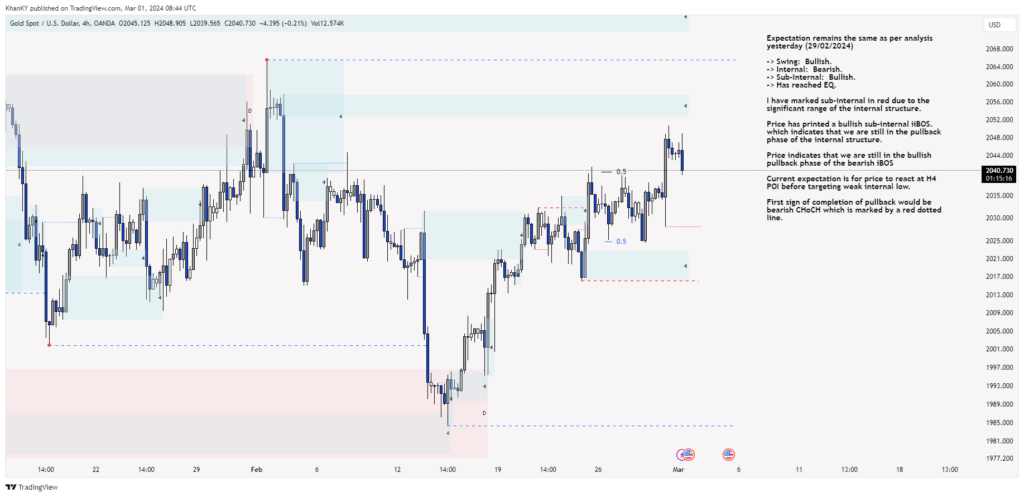
Expectations from H4 Analysis
The H4 analysis indicates the market sentiment based on various factors such as swings, internal structures, and key levels. It looks at a few things to figure this out: swings, internal structures, and important levels in the market.
Right now, it seems like most people are feeling pretty good about it because the swings show a positive trend. But it’s not all sunshine and rainbows!
There are some mixed signals, meaning not everyone is completely confident.
However, if we dig a little deeper, we can see that there’s still a positive trend happening within the market. And when we look at the important levels, it seems like things are balanced out, which is good to know for traders. Let’s have a look at it briefly.
Swing: Bullish sentiment persists.
Internal: Mixed signals with a bearish inclination.
Sub-Internal: Bullish trend observed.
Key Levels Reached: Equilibrium level attained.
Interpretation of the H4 Chart
The H4 chart snapshot shows the current market conditions and the expected price movements.

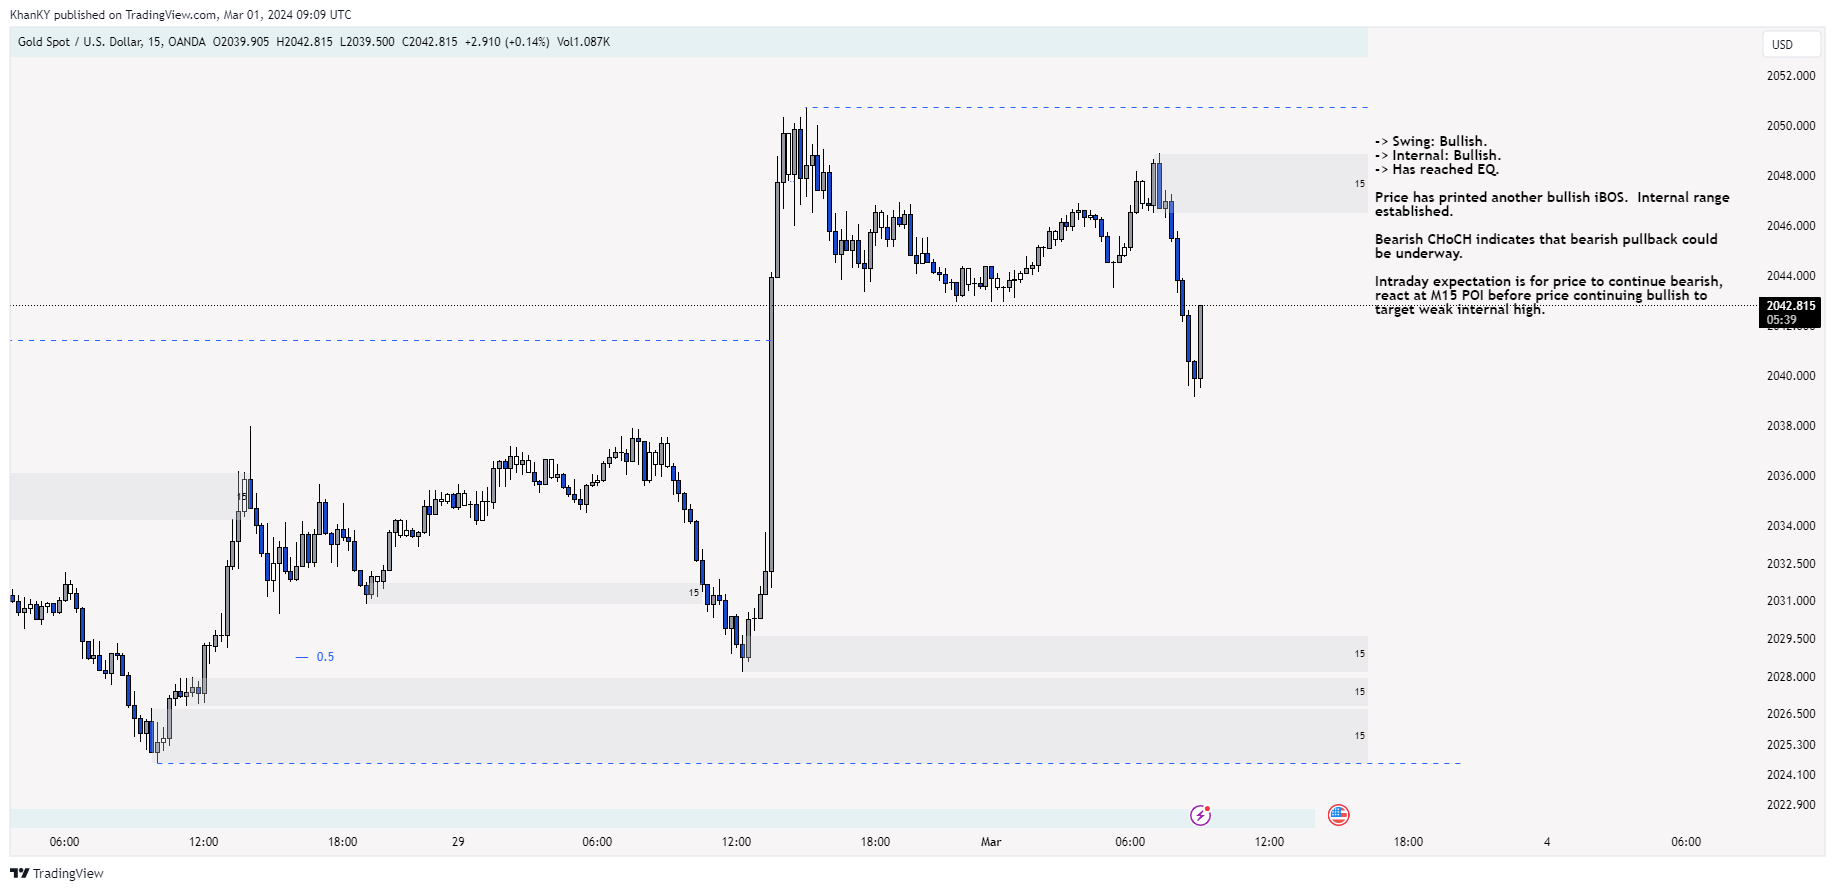
Key Points from M15 Analysis
M15 analysis is all about shorter time frames, specifically looking at movements within a single trading day. When it mentions “swing,” it’s indicating that there’s a bullish trend happening, which means that prices are likely to rise.
The “internal” aspect refers to a bullish pattern that’s being observed within the market. When it mentions “key levels reached,” it means that the price has reached a point of equilibrium where supply and demand are balanced. Let’s take a brief look at it.
Swing: bullish trend
Internal: bullish pattern.
Key Levels Reached: Equilibrium level attained.
In terms of intraday expectations,the analysis looks at what might happen with prices during the day. It focuses on short-term trends and spots levels where prices often bounce back or struggle to go higher. This helps traders decide when to buy or sell based on these short-term moves.
Interpretation of the M15 Chart
Let’s take a closer look at what the M15 chart is telling us about short-term price movements and potential trading opportunities.
Intraday analysis of XAU/USD gave a complete overview of short-term price movements and market sentiment. Traders can make good decisions and capitalise on intraday opportunities by understanding patterns on multiple time frames.