Hello Everyone!
Investing your money can feel like a big challenge, but it doesn’t have to be scary. In fact, with the right plan, it can actually help you make more money! Long gone are the times when you could just put your money in something like the S&P 500 and wait for it to grow. These days, being more active with your investments can give you even better results, especially if you look at indices like the NASDAQ 100 (NAS100).
This index is full of exciting opportunities, particularly in technology and biotech companies. So, let me provide you a simple guide to help you get started on your investment journey. Let’s focus on how to make smart choices with NAS100 stocks that will keep your portfolio strong and growing for the future.
1. What is an Index?
It’s essential to have a solid grasp of the index you’re considering before you understand the investing. In this case, we’re talking about the NASDAQ 100 (NAS100). This index is made up of the hundred largest non-financial companies that are listed on the NASDAQ stock exchange. It means these companies aren’t banks or other financial institutions. Instead, they’re often in industries like technology and biotechnology. So, when you invest in the NAS100, you’re essentially investing in a group of big, influential companies from these sectors.
2. Analysis of Trading position of the Index
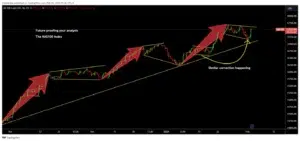
Now, let’s talk about analysing where the index is at in terms of its trading position. This is like taking a snapshot of the overall market to see how things are going. When we say “trading position,” we’re basically asking, “Is the market doing well right now, or is it struggling a bit?”
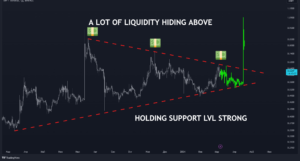
One important thing to look for is whether the index is going through what’s called a “corrective phase.” This basically means that the value of the index has dipped from its recent highs. It’s like when a rollercoaster takes a little dip before shooting back up again. During this corrective phase, some investors see it as a good opportunity to buy stocks at lower prices, hoping they’ll bounce back up in value later on. Here is the depiction of the chart of the corrective phase.
However, it’s not enough to just look at the overall market. You also need to research deeper and check how individual companies are doing. Just because the index as a whole is correcting doesn’t mean every company within it is a good buy. Some might be struggling more than others, so it’s important to assess the health of each company before deciding where to invest your money.
Now we will understand the components of the NASDAQ index, so you can easily find all the companies listed on the NASDAQ 100 by doing a quick Google search. The NASDAQ 100 is made up of 100 different companies, so there’s a lot to explore.
Here, we’ll focus on the three biggest ones: Microsoft, Apple, and Alphabet.
We’ll take a look at these companies from two angles: fundamental analysis and technical analysis. Fundamental analysis means we’ll peek into their financial health by checking out things like their balance sheets (do they owe a lot of money?), income statements (are they making more money over time?), and cash flow statements (are they generating positive cash flow?).
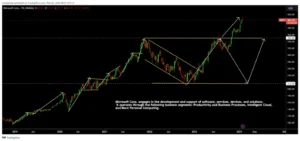
1. Technical Analysis of Microsoft
They develop and support software, services, devices, and solutions. They’re split into three segments: Productivity and Business Processes; Intelligent Cloud; and More Personal Computing.
Debt : Yes, they have debt. In 2023, their total debt was $79.44 billion.
Revenue Growth : Their revenues have been steadily increasing over time: in 2021, it was $168 billion; in 2022, $198.27 billion; and in 2023, $211.92 billion.
Free Cash Flow : They do have positive free cash flow, reaching $59.48 billion in 2023.
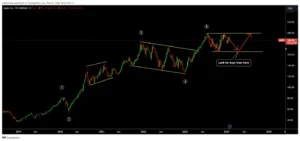
2. Technical Analysis of Apple
They design, manufacture, and sell various tech products like smartphones, computers, and wearables, along with related services.
Debt: Yes, they also have debt. Their total debt was $123.93 billion.
Revenue Growth: Apple’s revenues have consistently risen over time: in 2021, it was $365.82 billion; in 2022, $394.33 billion; and in 2023, $383.29 billion.
Free Cash Flow: They have positive free cash flow, amounting to $99.58 billion.
3. Technical Analysis of Alphabet
Alphabet, Inc. is a conglomerate that oversees various businesses, with Google being its flagship segment. Google encompasses a wide array of internet services such as ads, Android, Chrome, YouTube, and more.
Key Metrics
Does the company carry debt?
Yes, Alphabet has a debt of approximately USD 29.87 billion.
Are the company’s revenues showing consistent growth?
Absolutely. In 2022, Alphabet recorded revenues of USD 280.88 billion, which increased to USD 307.16 billion in 2023.
Does the company generate positive free cash flow?
Indeed, Alphabet boasts a healthy free cash flow of USD 69.50 billion.
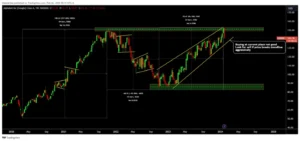
Buying Alphabet’s stock at its current price may not be favourable. It’s advisable to consider selling if the price aggressively breaks below the trendline.
Here are our recommendations for the three stocks:
Microsoft: No discernible trade setup at present.
Apple: Look for buying opportunities around the USD 170.8 mark.
Alphabet: It’s not the best time to buy now.
Watch for potential selling opportunities if the price breaks the trendline sharply.
We’ll also scrutinise other stocks in the index using similar criteria to pinpoint the most promising investment opportunities.
Best of luck on your investment journey, and stay tuned for more insightful content from us.