Stage analysis is a dominant trading technique developed by Stan Weinstein, which dissects market trends into distinct phases, each presenting unique opportunities and challenges.
This article will provide traders with a structured framework to understand and anticipate market movements, particularly in the realm of stock trading.
Stan Weinstein’s Stage Analysis
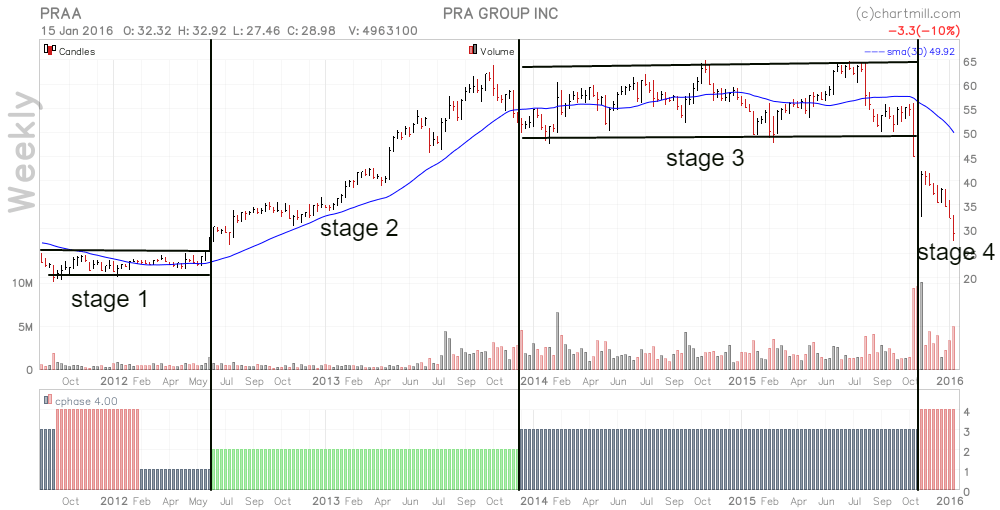
Stan Weinstein introduced stage analysis in his amazing book “Secrets for Profiting in Bull and Bear Markets,” presenting a systematic method for assessing market phases. This method breaks down the market cycle into four clear stages. Each stage shows a different part of a stock’s journey, with its special price changes and how investors act.
Weinstein’s method relies on using technical analysis, like studying how prices move and trading volume. By figuring out which stage a stock is in, traders can better guess where it might go next. This helps traders decide when to buy or sell, matching their plans with how the market naturally moves. It’s important to know that this method works for both short-term trading and long-term investing.
In the following sections, we will look at the four stages of Weinstein’s methodology.
Basing stage
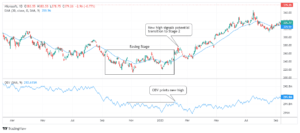
In Weinstein’s stage analysis, the initial phase, known as stage 1 or the basing stage, marks the start of a stock cycle. This stage follows a downtrend and is characterized by a period of consolidation. During this time, prices tend to move within a narrow range, showing uncertainty as market sentiment shifts from negative to neutral.
In the basing stage, trading volumes typically decrease as selling pressure diminishes. As buying volume rises, indicators like on-balance volume (OBV) often reach their lowest point and start to climb along with prices. OBV tracks volume flow, indicating whether more volume is entering or leaving an asset.
In this, investors keep an eye on the flattening of price moving averages, signaling a slowdown in downward momentum. This stage presents an opportunity for smart investors to accumulate stocks, anticipating potential future gains. Traders proceed with caution since stocks can remain in this phase for a long time, and entering too early can tie up capital in inactive investments.
Traders who use Weinstein’s approach watch for this phase to find possible times to enter the market. They pay attention to stocks that seem like they might start rising from their current level. If they can successfully spot when the market moves from Stage 1 to Stage 2 – the Advancing Stage – it could mean they’re getting in early on a new uptrend, which could lead to profitable opportunities.
Advancing stage
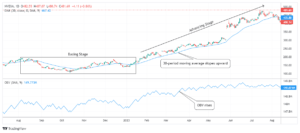
In stock stage analysis, Stage 2, commonly referred to as the advancing stage, presents investors with potential opportunities for gains. This phase begins when a stock breaks out of the basing stage (Stage 1) with significant trading volume. It marks a shift from a neutral to a bullish market sentiment as more investors recognize the market’s potential.
A prominent feature of Stage 2 is the sustained upward movement in the stock’s price, often accompanied by increasing trading volumes. During this stage, the price typically surpasses key moving averages, such as the 30-period moving average, which acts as a dynamic support.
The OBV indicator is helpful right now. When prices are going up and the OBV line is also going up, it means good momentum. It shows that as prices are rising, the trading volume is also increasing, which supports the trend of prices going up. So, it confirms that the uptrend is strong.
Traders concentrate on stocks that maintain prices above crucial moving averages and exhibit consistent increases in OBV during this phase. This alignment of price and volume dynamics provides a more quick confirmation for continuing trades in the advancing direction.
Top Area stage
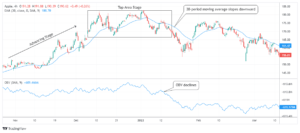
Stage 3, also called the “top area,” signals a significant change in the stock’s cycle from an uptrend to a possible downtrend. Here, the stock’s price stabilizes after Stage 2’s rise. It’s a distribution phase where early investors sell, and new ones may be attracted by past performance rather than future potential.
In Stage 3, price movements become less decisive, often moving sideways and establishing a resistance level that the stock struggles to surpass. Prices tend to hover around key moving averages, like the 30-period moving average, without a clear trend.
During this phase, volume analysis becomes essential. A discrepancy between price and volume starts to emerge; although prices may remain high, there is often a noticeable decrease in trading activity. This diminished volume suggests a lack of conviction among investors, implying that the stock may struggle to maintain its previous upward momentum.
Declining stage
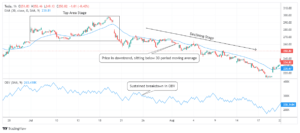
Stage 4 indicates the onset of decline, as a stock moves from distribution to a clear downtrend. This phase is characterized by a sustained decrease in the stock’s price, typically starting with a decisive drop below crucial support levels and moving averages, such as the 30-period moving average.
During the decline, trading volumes usually increase, indicating a growing consensus among investors that the stock’s best performance is in the past. Negative news or poor earnings reports can further accelerate this downward trend.
OBV remains crucial during this phase. A declining OBV suggests that selling pressure is mounting, reinforcing the downtrend. Lower highs and lower lows in both price and volume signify diminishing investor confidence and waning interest in the stock.
For traders, Stage 4 demands high caution. It’s often a signal to exit positions to mitigate potential losses. Experienced traders may employ short-selling strategies to profit from the market’s downward movement. However, it’s essential to have a risk management plan in place, given the volatility that can lead to rapid price changes during this phase.
Conclusion
Learning stage analysis can help traders better navigate the ups and downs of the stock market. By grasping the principles of each stage and using them in their trading, traders may make smarter choices that match what’s happening in the market.
Remember: In crypto, knowledge is power.
Join the conversation! What’s your take on the trading strategies? Share your thoughts below!
Disclaimer:This article represents the opinion of the Companies operating under the FXOpen brand only.
It provides general information and does not constitute financial advice. Always do your own research and consult with a professional before making investment decisions.